firmbee-com-gcsNOsPEXfs-unsplash

Embracing experimentation: Proving media’s impact in the new normal

Measuring media effectiveness is essential for marketers. However, as people adjust to the realities of our new normal, measurement has become increasingly difficult. Campaigns that deliver a healthy return on investment today may not work as well tomorrow.

In a constantly shifting and uncertain environment, businesses face an even greater need to make careful, impactful business decisions. Yet marketers must also understand how consumers react on a nearly real-time basis. As the path to purchase changes, marketers must be agile enough to adjust and optimize campaigns to capture customers in the right moment.

One of the best ways to know if your marketing is working is by running experiments. Experiments can be powerful tools to determine how many conversions each media type drove as a result of a marketing message — typically called incrementality, or lift — and how many would have occurred anyway, which in turn can be used to determine channel-level budgets. These experiments offer marketers a clearer understanding of what’s performing well and what can be improved.

Marketers must understand how consumers react on a nearly real-time basis to adjust and optimize campaigns.

Whether incrementality experiments are the right tool for you, and how deeply you should invest in them, depends on the realities of your business situation. To understand which activities are most worthwhile, start by evaluating your stage of business recovery, and consider the costs and benefits of different testing strategies.

modes of business recovery and measurement

There’s no one-size-fits-all measurement approach for these fast-changing times. The right strategy depends on your goals, your customers, and the marketing conditions in your industry right now.

To help you assess your best measurement options, and the pace at which to implement marketing experiments, we’ve divided businesses into three broad modes of business recovery.

Crawling to stability

Perhaps your industry has been negatively impacted by the pandemic and is recovering from a loss of revenue. If consumer behavior is still evolving rapidly — like that around air travel — it may not be a good time to run a full-fledged incrementality study. That’s because any insights you gather today may lose value as time goes on.

Instead, optimize campaigns for the short term, maximize immediate cash flow, and look to boost conversions quickly. Quick learning can be impactful for revamping your marketing strategy or developing new creative approaches. Businesses that have sufficient volumes of data can use data-driven attribution to learn which channels, formats, and campaigns play the biggest role in helping achieve marketing goals. By connecting data-driven attribution to automated bidding, you can measure changing consumer behavior and meet customer demand in real time.

Walking on the mild side

Industries experiencing volatility should start preparing for recovery, while proceeding with caution. Consumer priorities that have shifted as a result of the pandemic, such as ordering takeout instead of dining in, could one day shift back. Short-term KPIs, and anything you learn from them, could be less relevant in the future. However, building organizational agility now can help you prepare for what’s next and drive growth in the long run.

Focus on improving existing campaigns and increasing volume from your current customer base through quicker optimization-focused tests and experiments. Set up a principled approach for testing and analyzing results, such as a weekly pulse check on sales stability. Consider using tools that help you run A/B tests on a portion of your ads to see how small changes to your campaign, such as ad copy, keywords or a landing page, impact your results. As your experiment runs, you can monitor and compare its performance against your original campaign and roll-out changes that are performing well.

Consumer priorities that have shifted as a result of the pandemic could one day shift back.

Running at full speed

Some industries have experienced a surge of revenue due to stay-at-home orders. If your business is dealing with increased demand, running incrementality experiments can help you understand the true value of your optimized marketing strategy, inform channel-level budgeting, and gain causal insights.

Since you’re likely appreciating stable sales growth, you can run multiple incrementality tests, including user-level and geo-based studies. For example, to evaluate a new YouTube campaign strategy, you can run Brand Lift, Search Lift and Conversion Lift tests to measure the full-funnel impact, from ad recall through to conversions. You can also use these insights to find out which creative and audience strategies are most effective in driving lift.

Geo experiments are a useful alternative to user-based studies if you want to evaluate the impact of your ads on in-store sales, or if you’re looking for a fully transparent and replicable methodology. These tests divide the country into geographical regions, and then randomly assign each region to either a test or a control group. By showing ads in one region and not the other, you can measure whether your marketing is having an impact. For the validity of a geo experiment, it’s important to avoid any factors that could unilaterally influence the test or control group, such as store closures in a test region only.

Keep in mind, because different geographies have adopted different responses to COVID-19, brands should have at least one month’s worth of stable data for both regions before running any tests. Given uncertainty regarding baseline conversion rates and effect sizes, be conservative when estimating the power of these studies.

No matter which stage of recovery you’re in, businesses navigating new media plans and measurement tools should start simple.

When running any tests, be mindful that performance may be unusual, and consider how likely test results can be generalized to business-as-usual contexts. If you’re investing more than usual during this period to drive growth, remember that the extra marketing investment may result in lower incremental returns on investment. Test again once your marketing budgets are back to their usual levels.

Not business as usual

In a changing environment, marketers need to listen more closely to customers than ever to make each dollar count. No matter which stage of recovery you’re in, businesses navigating new media plans and measurement tools should start simple.

Continue to use your organization’s sources-of-truth measurement strategies. Once you’ve optimized your campaigns within the new normal and are experiencing performance stability, marketing experimentation is a great way to validate and increase the efforts that deliver growth for your business.

stephen-dawson-qwtCeJ5cLYs-unsplash

Incrementality: The correct way of market measurement

one of the business side effects of the pandemic is that it has shined a very bright light on marketing budgets. This is a good thing in any circumstance; your marketing should be earning its keep. And this scrutiny is particularly beneficial in times when companies might not be doing well financially.

A focus on budgets means a focus on conversion. From there, it is a quick leap into an in-depth discussion of attribution and incrementality. And while those two often get lumped together, they’re not at all the same thing.

Attribution is simply the science (or, too often, the art) of distributing credit for conversions across your various marketing channels. When we do attribution modeling in tools like Adobe or Google Analytics, we are essentially saying that if there were four interactions with our owned, earned, and paid media channels before a last-click conversion from paid search, then the credit for that conversion should be distributed to all the interactions.

The question incrementality asks is “How many of those conversions would have happened anyway, without any advertising spend?”

Incrementality is incredibly hard to measure. Just think of all the data you need to collect to figure out the answer. It’s also incredibly complex to measure — in part because when senior leaders ask the incrementality question, they often mean something different.

To help you get a better handle on it, let me share the three types of marketing incrementality and how each type can be used.

Channel-silo incrementality

Let’s say you spend a lot of money on paid-search advertising. Excellent!

An incrementality-curious executive might ask you: “How many of the conversions we received from paid search would we have gotten anyway because of our organic search listings?”

This is what I call channel-silo incrementality.

You can, for example, conduct conversion lift studies for your direct-response advertising. You can measure channel-silo incrementality delivered for your brand advertising as well. (Here are detailed instructions on exactly how to do that on Google’s Display and YouTube advertising platforms.)

Another option is randomized, controlled experiments. These are user-level experiments (as opposed to geo-level tests, like match-market tests) that use causal methodology to determine whether an ad actually changed consumer behavior. They randomly divide target users into two groups: We show ads to one and withhold ads from the other. This is the easy comparison of users who were and would have been exposed to the ads.

Some would say channel-silo incrementality is not true incrementality, and they’re right. But it is still helpful for achieving a tactical understanding of how to optimize your advertising in an individual channel.

You can measure channel-silo incrementality delivered for your brand advertising.

If you are spending $2 million on paid search each month and it has 16% incrementality, the first thing you do is identify the keywords driving that 16%. The second thing you do is identify other opportunities where the organic search is weak. Then you pour budget into paid search for those keywords, because it’ll drive incremental conversions.

Cross-stack incrementality

Some companies you advertise with will offer you multiple options. For example, you can advertise on Google Search, Google Display, and YouTube.

An incrementality-curious executive might ask you: “What is the incrementality across my advertising on Google-owned properties?”

I call this cross-stack incrementality.

Example of cross-stack incrementality

  • Google stack incrementality
  • Facebook stack incrementality
  • Other channel silos
Think with Google

Is all that spending delivering incremental conversions? The answer is most definitely “no.”

You might have gotten some of the same conversions from YouTube as from Google Search. You might have gotten all of the same conversions from Search that you got from Display. And so on and so forth.

Due to the complexity of measuring cross-stack behavior, most ad stacks don’t offer a way to measure cross-stack incrementality.

Running clean, matched-market tests, in which you compare the behavior of users in a single control region with the behavior of users in a single test region, is a good way to measure cross-stack incrementality. Another route, if you spend a whole lot on any ad stack, is to use advanced modeling like conversion modeling.

Cross-stack incrementality helps you optimize on-stack budget allocations as well as on-stack optimizations.

Marketing-portfolio incrementality

Measuring across all activity is the hardest part of marketing analytics.

An incrementality-curious executive might ask you: “What is the incrementality across all the marketing activity I spent money on?”

I call it marketing-portfolio incrementality.

In other words, what is the true incrementality of the money spent on Google, YouTube, Display, Facebook, cinema, print, television, channel marketing, and promotions?

How many sales did all that money really deliver? You can ask the same question for a brand metric, say unaided awareness or consideration. How much of the brand lift in metric X would not have occurred without the ad spend?

When measured correctly, the impact of incrementality on your marketing decisions can be transformative. But measuring it is really, really hard. And it can produce seemingly conflicting findings. One year, those billboards we buy in every city can be entirely useless in an incrementality context. Another year, billboards deliver so much incremental brand lift, we should shut down social-media ads. You get the idea.

Marketing-portfolio incrementality, like cross-stack incrementality, can be measured with matched-market tests.

Regardless of your business or budget size, you need to understand the concept of incrementality.

Marketers running large campaigns across multiple channels often use marketing mix modeling (MMM). When done right, it’s good for evaluating media performance and optimizing budgets across media types for long-term budgeting decisions. But I have my own issues with MMM. First, it typically understands each channel in a silo and, hence, effectively identifies channel-silo incrementality. Second, as practiced in many companies, MMM incorporates human bias into the model. These models also require an enormous amount of spend to get a decent signal and take a long time to produce.

This is the approach I prefer.

  • Use multiple machine learning–based algorithms to first understand the underlying relationships inside the data, removing human bias.
  • Construct an influence graph across the entire portfolio, removing silo analysis.
  • Understand conditional dependencies across all random variables to identify coefficients, and do so over smaller datasets.

This MMM method is very scalable, smart, and allows you to do both backward-looking analysis (how did we do) and forward-looking predictions (how much should we spend based on diminishing return curves).

Regardless of your business or budget size, you need to understand the concept of incrementality. I mean, really get it. In addition to the benefits to your marketing, it just might get you a raise and a promotion.

jeff-sheldon-9SyOKYrq-rE-unsplash

Optimizing brand awareness: Using the right smart tools

with the continued rise of digital video, advertisers and brands are changing their strategies, driving brand awareness and proving campaign impact. YouTube’s new tools reduce the effort needed to keep up with these consumer trends while achieving strong awareness results. Here are three approaches marketers should consider.

Outline a plan with Reach Planner

Before setting up your campaign, make sure you plan for maximum effectiveness. Reach Planner uses real-time YouTube data to show you the expected reach based on your campaign settings: audience, budget, ad types, and more. Tweak your inputs and you’ll see how they affect your campaign’s projected reach and frequency by audience.

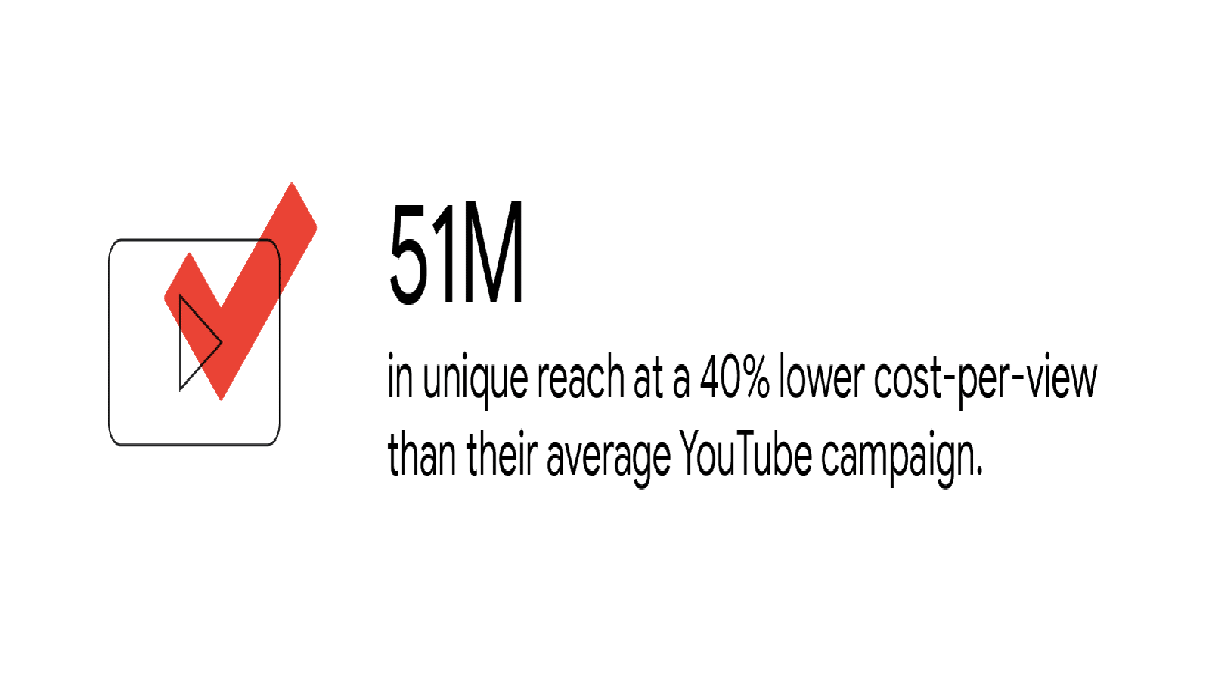
Carter’s, the children’s clothing store, used Reach Planner for its “Hello Optimism” campaign to understand the reach and frequency of both its first-party audience and Google audience segments for new moms. Carter’s agency, Merkle, was able to identify the right budget and strategy required to drive the most impact for a large unique audience. As a result, the team’s YouTube campaign delivered a unique reach of 51 million at a 40% lower cost-per-view than their average YouTube campaign.

With TV in Reach Planner, you can also plan YouTube alongside TV to understand the combined reach and improved efficiency of your overall campaign. In this two-minute case study video, the team at Pepsi Vietnam explains how they used TV in Reach Planner to achieve 19% more reach for a campaign promoting Mirinda, a leading Vietnamese soda.

Optimize your media buys with Video reach campaigns

To drive maximum brand awareness and ad recall, we recommend using two or more CPM formats (skippable, non-skippable, or 6-second bumper ads). To take the guesswork out of allocating budget between the CPM formats you select, we developed Video reach campaigns. Video reach campaigns can automatically optimize across multiple ad formats to reach as many people as possible for the lowest price. In testing, we saw that, on average, Video reach campaigns drove from 29% to 44% more reach at a 16% lower CPM than campaigns using individual formats.1

L’Oréal Portugal achieved its highest campaign reach ever by using Video reach campaigns to promote Elvive Dream Long serum. Relying on automation to maximize reach and awareness outcomes, L’Oréal reached 32% more viewers while simultaneously lowering its cost per reach point by 41% compared to its manually optimized YouTube campaigns. This YouTube campaign helped Elvive Dream Long achieve the top ranking in the European serum market.

Measure your results and adjust your campaign with Brand Lift

Lastly, measurement solutions are critical when it comes to fully understanding campaign impact and adjusting in real time. Brand Lift allows you to measure ad recall and brand awareness impact directly attributable to your campaign. And now it supports accelerated measurement to help you gauge impact in the critical first days of your campaign. A new remeasurement option can help you also understand the impact of any mid-flight optimizations or creative swaps.

In addition to our Brand Lift solutions, we’ve also partnered with third-party measurement solutions to understand performance relative to other media platforms. In a marketing mix model (MMM) meta-analysis we commissioned with Nielsen, YouTube showed greater incremental sales per impression than TV in 91% of CPG MMMs that measured YouTube, other digital, and TV from 2017 through 2019.2 To help you take advantage of these results at scale, we’re dedicated to making it easier and more efficient to find and engage consumers on YouTube with these new planning, buying, and measurement solutions.

carlos-muza-hpjSkU2UYSU-unsplash

The dynamics of data & insights strategy

Israel Mirsky, executive director of global technology and emerging platforms at OMD, shares how the global media agency built data intelligence tools that enabled their clients to pivot at speed, helping them navigate 2020’s rapidly changing landscape.

Connected by a shared data resource, teams can navigate complex planning and optimization issues at speed. In other words, they can make better decisions, faster.

With a data-driven foundation for tracking ongoing changes in the market, we can identify which trends will last. We can react quickly to those that won’t. And we can look to real-time data signals to monitor changing behavior and make smart predictions. It’s no longer sufficient to plan as events develop, since long-term plans are often obsolete by the time they launch. Instead, we’ve found it necessary to plan across a range of outcomes so our teams and clients can take advantage of fleeting trends.

Bacardi did this very effectively last summer, when it used the Fast Start Dashboard to shift marketing dollars to its ready-to-drink Bacardi Rum cocktails. As the latest data, including Google’s mobility trends, began to reflect changing sentiment and increased interest around outdoor social activities, Bacardi made the decision to rework its budget. As reported in The Wall Street Journal, Bacardi put 65% of its planned media budget in the U.S. behind the product’s launch in May, then increased its June and July spend to the same levels — up from 10% and 0%, respectively.

We’ve found it necessary to plan across a range of outcomes so our teams and clients can take advantage of fleeting trends.

Other brands used the dashboard to keep track of rapidly shifting demand across locations. In March 2020, following store closures throughout Europe, a major retail client reassessed its brand media activity in the region. Alongside the retailer’s own data, real-time insights from the dashboard highlighted short-term rebound opportunities. The data streams gave the brand visibility across differences by market, revealing where demand was shifting to e-commerce, as well as signs of pent-up demand during prolonged periods of physical store closures.

Search signals indicating short-term product demand, combined with the lower cost of media placements due to reduced advertising competition, led the company to focus on markets such as Germany, where there were more positive signs of recovery. The signals also gave them reason to shift focus to e-commerce and social channels. Later in the year, the retailer would leverage those same learnings to prepare for future opportunities.

While we all hope to see more positive change this year, we still have to contend with the uncertainty that lies ahead.

Clients have also used the Fast Start Dashboard to help chart behavioral and social change across regions. In Spain, consumer confidence took a nose-dive when employment did. The dashboard allowed teams to track recovery. In Sweden, even without a government-mandated lockdown, the dashboard captured clear signals indicating that the situation was changing. By using these types of market signals and acting early, advertisers can develop hypotheses to test and create multiple scenario plans, learning from geo-specific shifts in consumer behavior through periods of volatility.

While we all hope to see more positive change this year, we still have to contend with the uncertainty that lies ahead. It’s likely that consumer behavior will continue to be unpredictable. Therefore, it’s essential that brands are ready to create agile, insight-led plans and have continued access to the data they need to react in real time.

1997_Omnicom_thumbnail_jDfRtpS

The dynamics of data & insights strategy

To say that consumer behavior remains unpredictable in 2021 might be the understatement of the year. Some of the trends of 2020 have sustained momentum, while others burst onto the scene and disappeared just as quickly. That dynamism makes it critical for brands to base important marketing decisions on real-time data and insights.

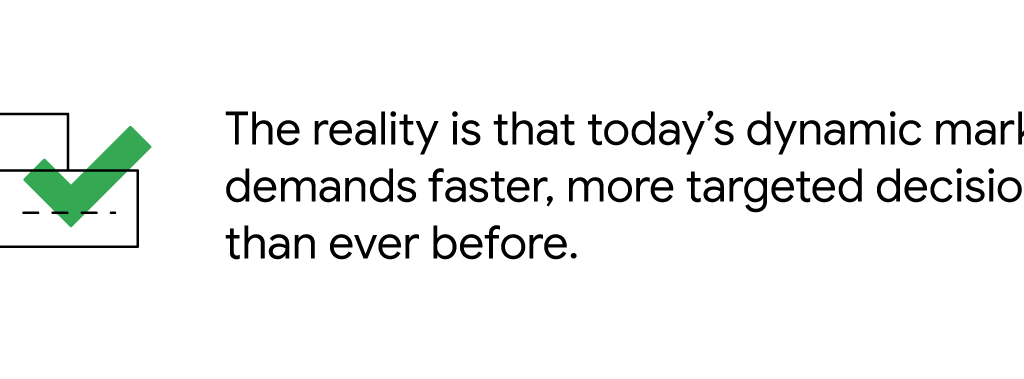
Access to data isn’t the problem, however. Far from it. There’s no shortage of data pouring in from myriad sources, leaving few clues as to how best to action the deluge. But the reality is that today’s dynamic market demands faster, more targeted decision-making than ever before.

To create opportunity from this complexity, we built a tool that pulls together relevant signals from disparate data sources, giving marketers a detailed overview of the evolving landscape. The Fast Start Dashboard contains over two billion fully anonymized data points from an ever-growing list of over 18 data providers, including Google Search and Maps, across over 40 markets. Users get a bird’s-eye view of media consumption, ad pricing and projections, consumer sentiment, foot traffic, shopping behaviors, and fluctuations in local COVID-19 hospitalization, case, mortality, and vaccination rates, to better understand how to meet consumer needs.

Connected by a shared data resource, teams can navigate complex planning and optimization issues at speed. In other words, they can make better decisions, faster.

With a data-driven foundation for tracking ongoing changes in the market, we can identify which trends will last. We can react quickly to those that won’t. And we can look to real-time data signals to monitor changing behavior and make smart predictions. It’s no longer sufficient to plan as events develop, since long-term plans are often obsolete by the time they launch. Instead, we’ve found it necessary to plan across a range of outcomes so our teams and clients can take advantage of fleeting trends.

Bacardi did this very effectively last summer, when it used the Fast Start Dashboard to shift marketing dollars to its ready-to-drink Bacardi Rum cocktails. As the latest data, including Google’s mobility trends, began to reflect changing sentiment and increased interest around outdoor social activities, Bacardi made the decision to rework its budget. As reported in The Wall Street Journal, Bacardi put 65% of its planned media budget in the U.S. behind the product’s launch in May, then increased its June and July spend to the same levels — up from 10% and 0%, respectively.

We’ve found it necessary to plan across a range of outcomes so our teams and clients can take advantage of fleeting trends.

Other brands used the dashboard to keep track of rapidly shifting demand across locations. In March 2020, following store closures throughout Europe, a major retail client reassessed its brand media activity in the region. Alongside the retailer’s own data, real-time insights from the dashboard highlighted short-term rebound opportunities. The data streams gave the brand visibility across differences by market, revealing where demand was shifting to e-commerce, as well as signs of pent-up demand during prolonged periods of physical store closures.

Search signals indicating short-term product demand, combined with the lower cost of media placements due to reduced advertising competition, led the company to focus on markets such as Germany, where there were more positive signs of recovery. The signals also gave them reason to shift focus to e-commerce and social channels. Later in the year, the retailer would leverage those same learnings to prepare for future opportunities.

While we all hope to see more positive change this year, we still have to contend with the uncertainty that lies ahead.

Clients have also used the Fast Start Dashboard to help chart behavioral and social change across regions. In Spain, consumer confidence took a nose-dive when employment did. The dashboard allowed teams to track recovery. In Sweden, even without a government-mandated lockdown, the dashboard captured clear signals indicating that the situation was changing. By using these types of market signals and acting early, advertisers can develop hypotheses to test and create multiple scenario plans, learning from geo-specific shifts in consumer behavior through periods of volatility.

While we all hope to see more positive change this year, we still have to contend with the uncertainty that lies ahead. It’s likely that consumer behavior will continue to be unpredictable. Therefore, it’s essential that brands are ready to create agile, insight-led plans and have continued access to the data they need to react in real time.

30_Awareness-Practitioner-Article_Inline_1

Optimizing brand awareness: Using the right smart tools

With the continued rise of digital video, advertisers and brands are changing their strategies, driving brand awareness and proving campaign impact. YouTube’s new tools reduce the effort needed to keep up with these consumer trends while achieving strong awareness results. Here are three approaches marketers should consider.

Outline a plan with Reach Planner

Before setting up your campaign, make sure you plan for maximum effectiveness. Reach Planner uses real-time YouTube data to show you the expected reach based on your campaign settings: audience, budget, ad types, and more. Tweak your inputs and you’ll see how they affect your campaign’s projected reach and frequency by audience.

Carter’s, the children’s clothing store, used Reach Planner for its “Hello Optimism” campaign to understand the reach and frequency of both its first-party audience and Google audience segments for new moms. Carter’s agency, Merkle, was able to identify the right budget and strategy required to drive the most impact for a large unique audience. As a result, the team’s YouTube campaign delivered a unique reach of 51 million at a 40% lower cost-per-view than their average YouTube campaign.

With TV in Reach Planner, you can also plan YouTube alongside TV to understand the combined reach and improved efficiency of your overall campaign. In this two-minute case study video, the team at Pepsi Vietnam explains how they used TV in Reach Planner to achieve 19% more reach for a campaign promoting Mirinda, a leading Vietnamese soda.

Optimize your media buys with Video reach campaigns

To drive maximum brand awareness and ad recall, we recommend using two or more CPM formats (skippable, non-skippable, or 6-second bumper ads). To take the guesswork out of allocating budget between the CPM formats you select, we developed Video reach campaigns. Video reach campaigns can automatically optimize across multiple ad formats to reach as many people as possible for the lowest price. In testing, we saw that, on average, Video reach campaigns drove from 29% to 44% more reach at a 16% lower CPM than campaigns using individual formats.1

L’Oréal Portugal achieved its highest campaign reach ever by using Video reach campaigns to promote Elvive Dream Long serum. Relying on automation to maximize reach and awareness outcomes, L’Oréal reached 32% more viewers while simultaneously lowering its cost per reach point by 41% compared to its manually optimized YouTube campaigns. This YouTube campaign helped Elvive Dream Long achieve the top ranking in the European serum market.

Measure your results and adjust your campaign with Brand Lift

Lastly, measurement solutions are critical when it comes to fully understanding campaign impact and adjusting in real time. Brand Lift allows you to measure ad recall and brand awareness impact directly attributable to your campaign. And now it supports accelerated measurement to help you gauge impact in the critical first days of your campaign. A new remeasurement option can help you also understand the impact of any mid-flight optimizations or creative swaps.

In addition to our Brand Lift solutions, we’ve also partnered with third-party measurement solutions to understand performance relative to other media platforms. In a marketing mix model (MMM) meta-analysis we commissioned with Nielsen, YouTube showed greater incremental sales per impression than TV in 91% of CPG MMMs that measured YouTube, other digital, and TV from 2017 through 2019.2 To help you take advantage of these results at scale, we’re dedicated to making it easier and more efficient to find and engage consumers on YouTube with these new planning, buying, and measurement solutions.

To learn more details about these products and other brand awareness methods, check out the Google Ads Help Center.